SHORE-BET: Coastal Community Benefit Tool
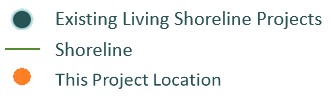
Living Shoreline Project Summary
|
Project Dimensions
Length: Linear Feet
High Marsh Width: feet
Low Marsh Width: feet
Marsh Area Protected:
Location Details
Public Access:
Storm Exposure:
Social Vulnerability:
Population Density:
|
|
Calculated Community Benefits
|
|
PER YEAR |
30-YEAR |
|
Reduced Storm Impacts |
|
|
|
Improved Fish Habitat |
|
|
|
Nutrients Removed/Stored |
|
|
 |
Carbon Removed/Stored |
|
|
|
Improved Recreation |
|
|
|
Total 30-Year Community Benefit Value
|
|
|
|
The 30-year value for each benefit is determined by multiplying the annual
value
by
a discount factor that adjusts future values to today's dollars. The weight
factor
applied was 22.39646, which is the 30-year weight factor with a 2% discount
rate,
source: Circular No. A-4, The White House, Nov 2023).
|
Description of Benefits
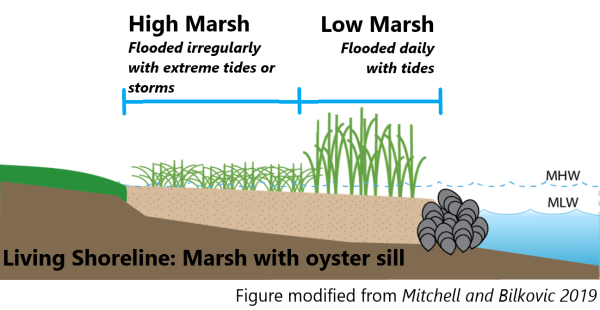
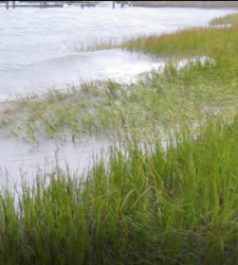
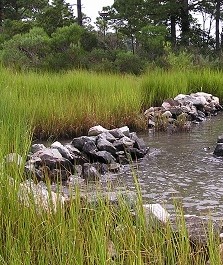
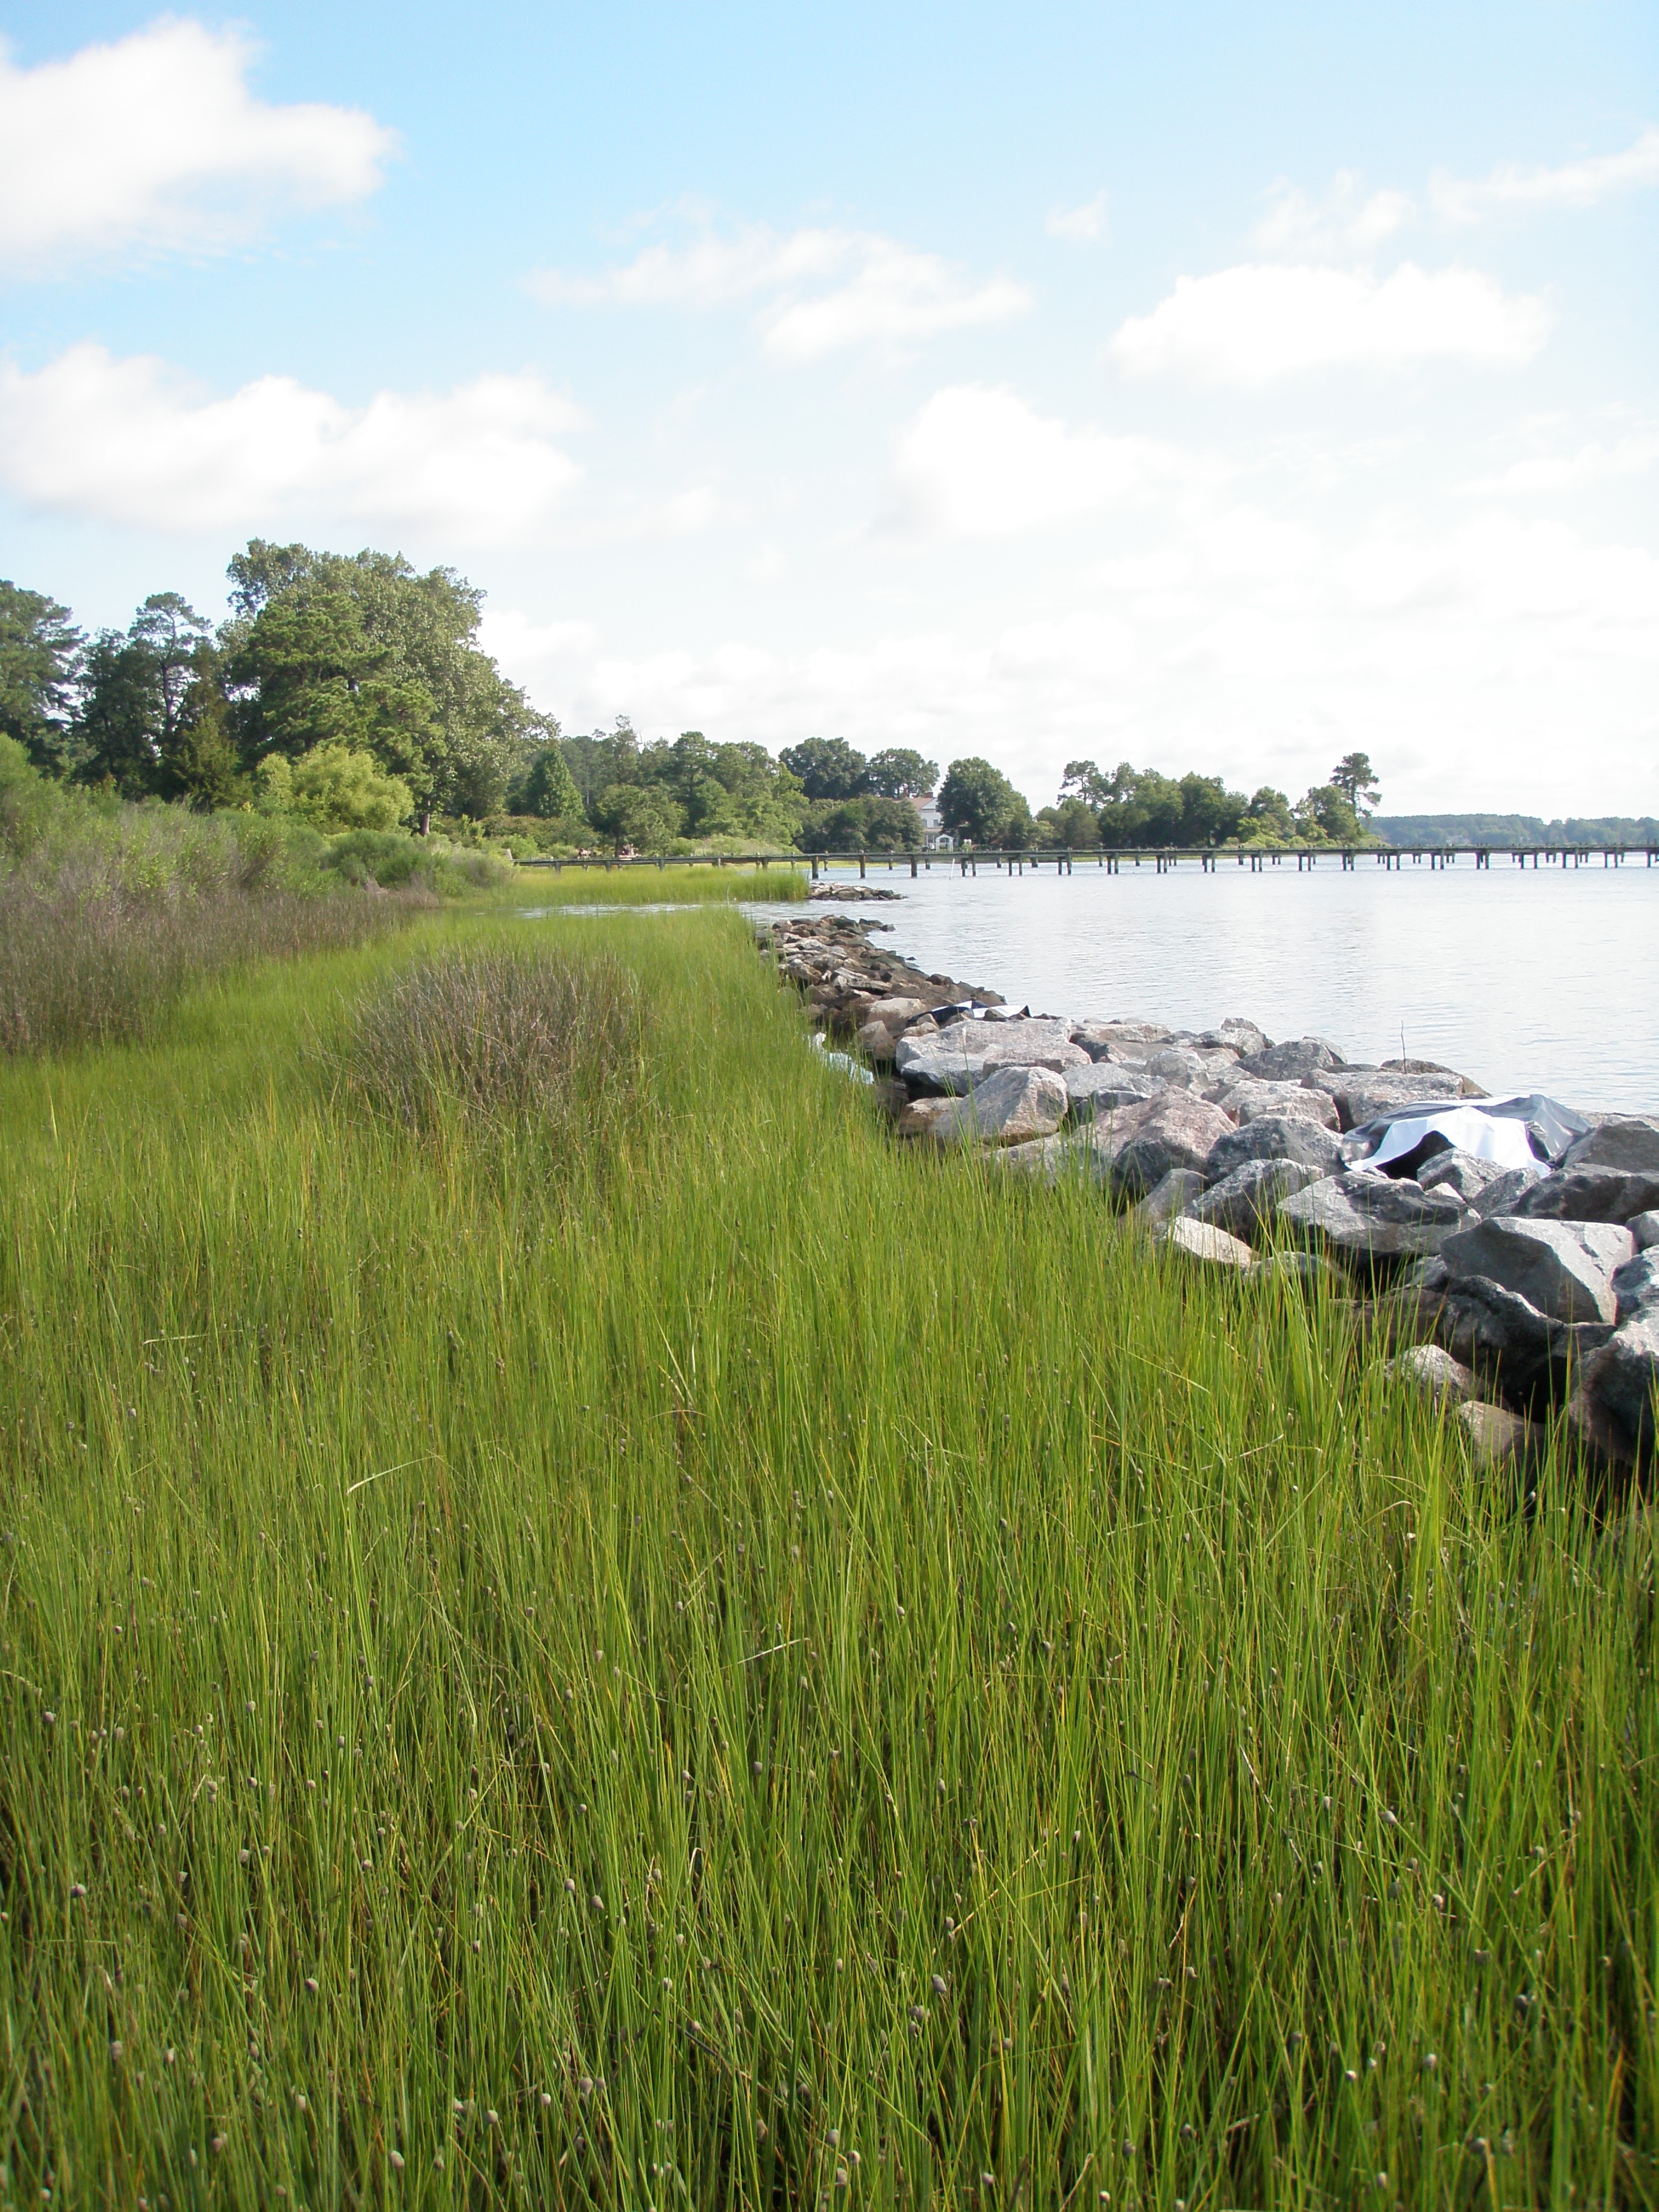
Reduced Storm Impacts:
Marsh vegetation and wetland areas absorb flood water and dampen wave energy,
reducing nearby flooding and damage due to waves.
Marshes also trap sediment which helps slow shoreline erosion.
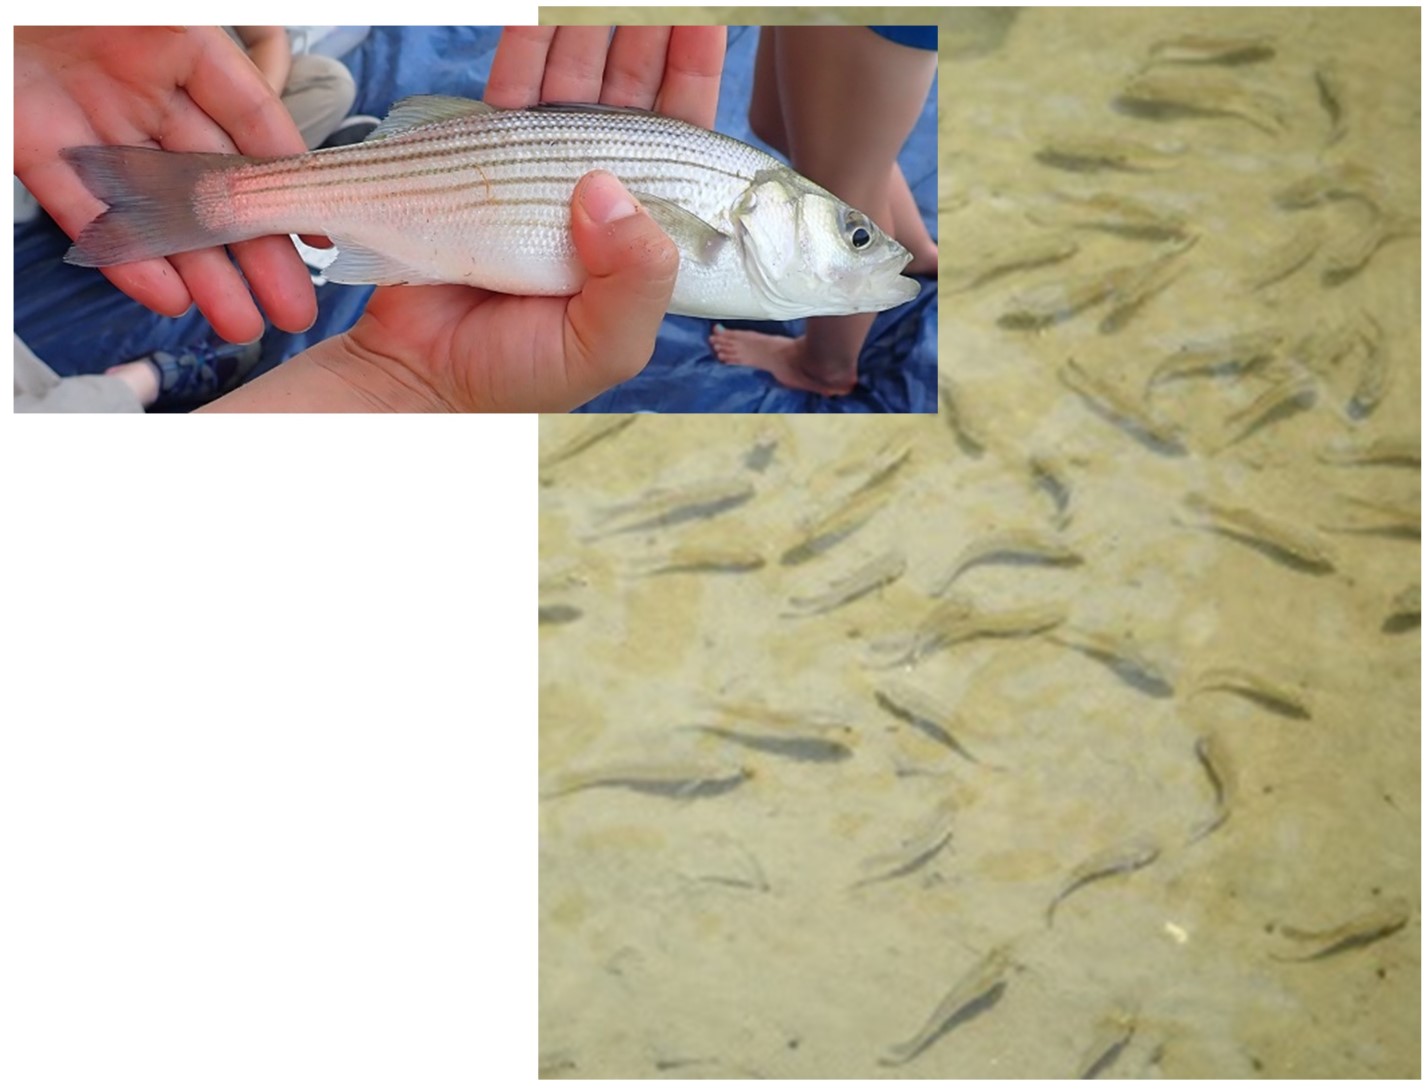
Improved Fish Habitat:
Marshes provide essential habitat for many fish and invertebrates (like crabs
and
shrimp), and especially for juvenile (young) and small-bodied fish and
crustaceans.
Marsh vegetation also provides cover from predators, and marshes that are
connected
along the shoreline can act as safe habitat corridors for these creatures.
Nutrient Removal/Storage:
Marsh plants absorb nitrogen and phosphorus from each high tide as well as
nutrients that flow off of the land from lawns, farm fields, and urban areas.
Excess
nutrients in the Bay stimulate nuisance algal blooms that decrease water quality
and
can be harmful to human and pet health.
Carbon Storage/Removal:Marshes can store large quantities of
carbon. Marsh
vegetation captures
carbon dioxide as it grows. As vegetation dies it is buried in the marsh soil,
where it remains for a long time due to the slow breakdown of vegetation in wet
marsh soil.
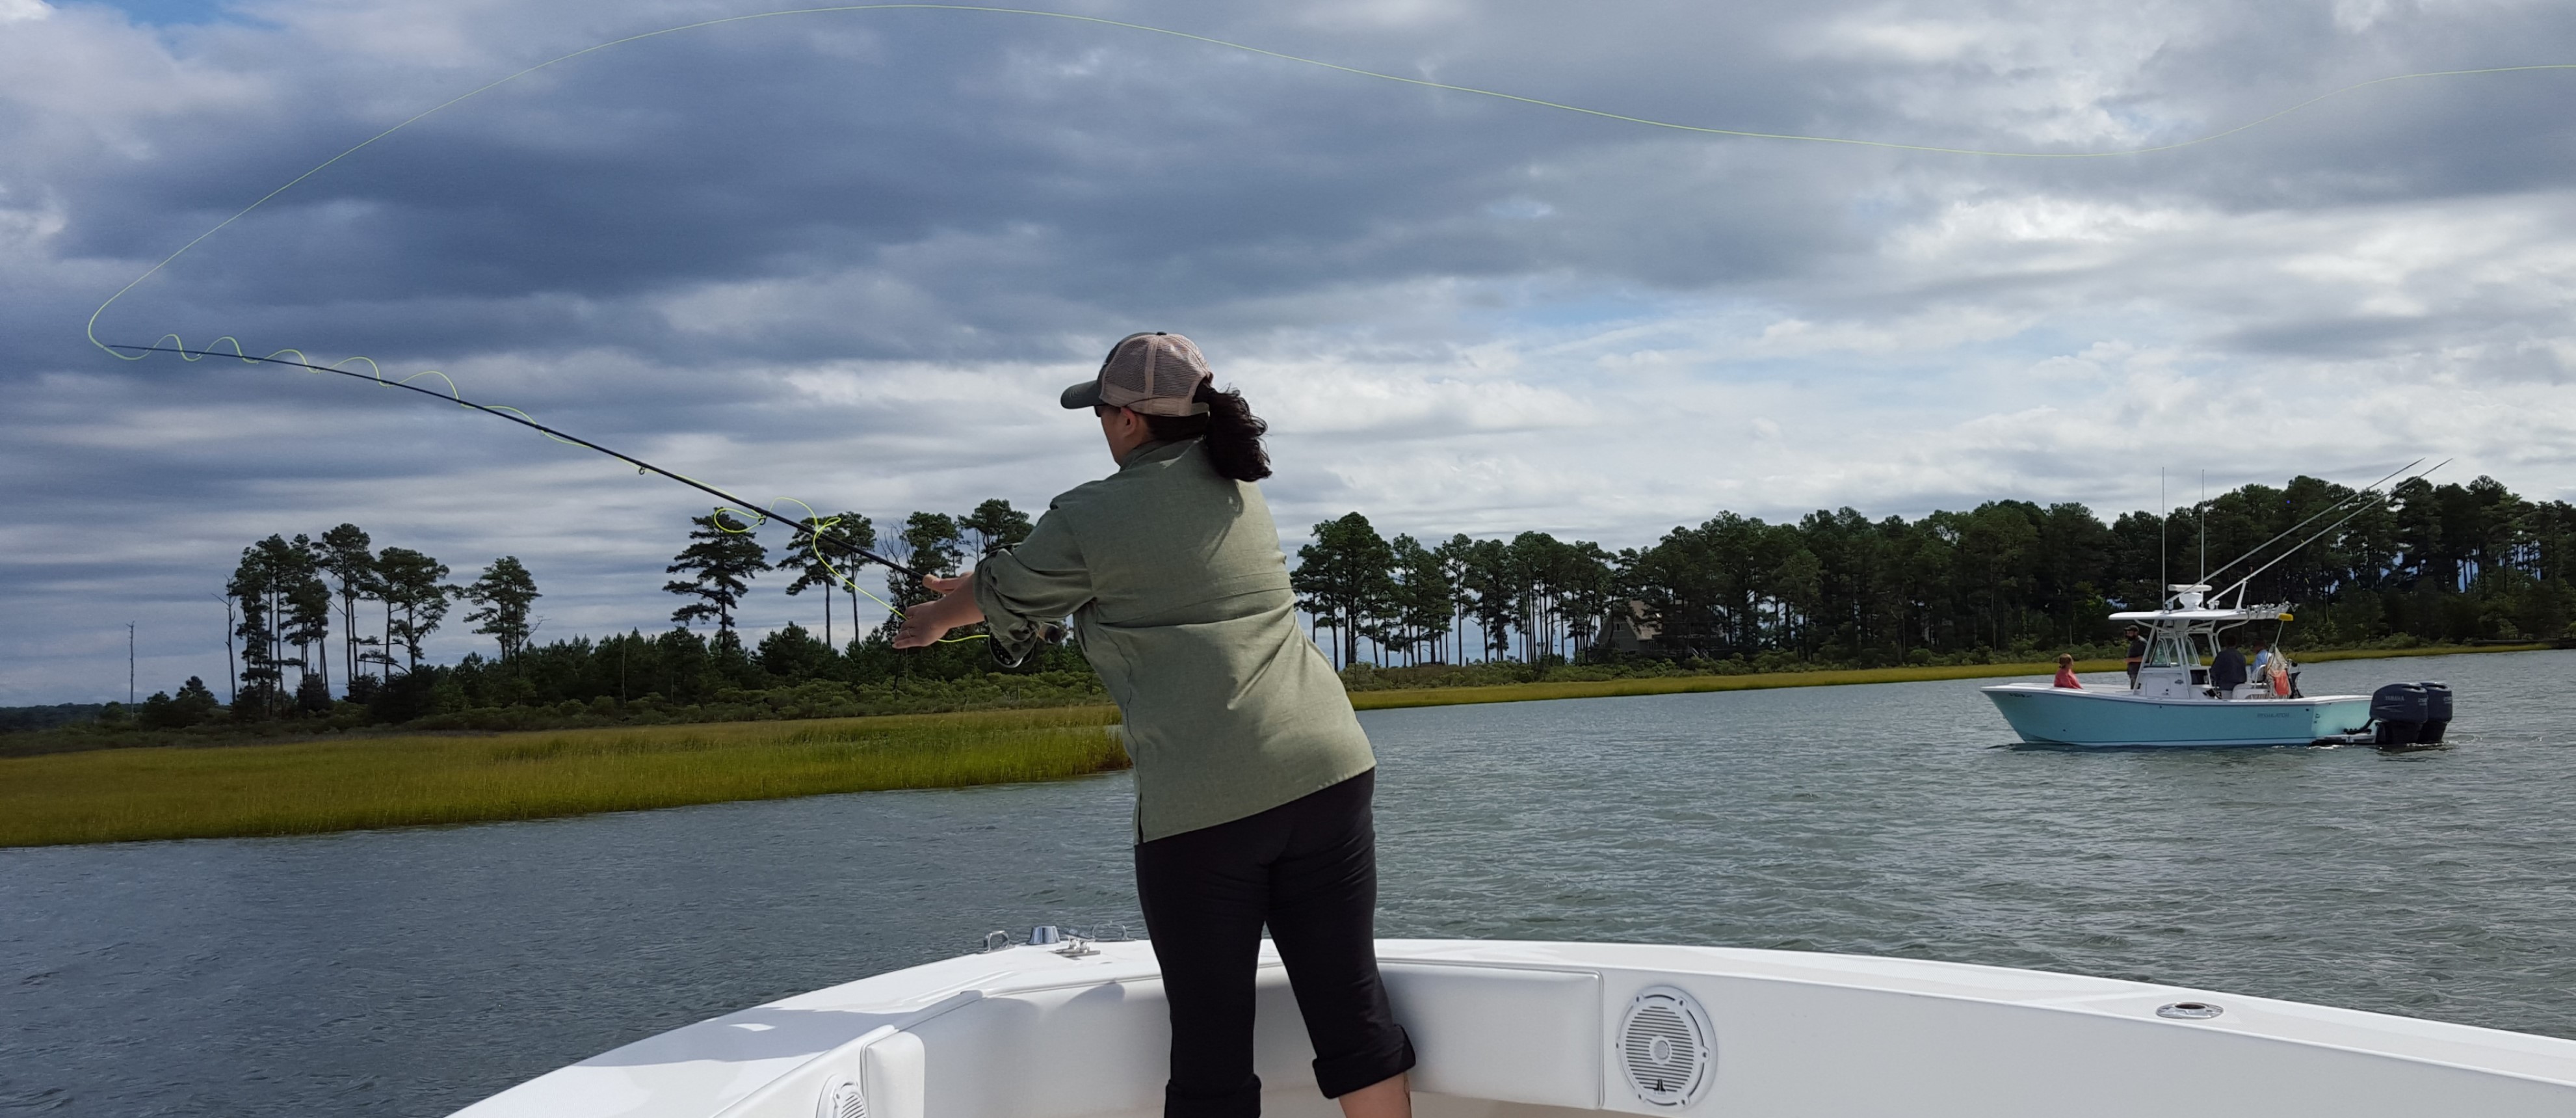
Improved Recreation: Marshy areas provide recreational
opportunities
including
birding, kayaking, and fishing, as well as providing aesthetic, cultural,
and
spiritual value.


 button at the
bottom
of the map to type in an address or place of interest.
button at the
bottom
of the map to type in an address or place of interest.
 button at the top of the
map.
button at the top of the
map. , and then add a new point.